
Traffic and analytics
BugOtter's analytics show who visits each app, where they came from, and which sources bring paying customers. It's one script tag with no cookies by default, so no cookie banner. Read this to add the script, track goals, read the dashboard, or find out why a number looks the way it does.
In 30 seconds
open your app → Setup → See your visitors, copy the script tag, paste it into the <head> of every page, and deploy. The step turns green when the first visit lands.
Add the script
One script tag, no cookies by default, so no cookie banner:
<script defer src="https://bugotter.com/bo.js" data-app="YOUR_APP_ID"></script>The Setup tab has the tag with your app's id filled in, and where to put it for your stack:
- Any site: in the
<head>of every page, before</head>. - Next.js: in
app/layout.tsx, inside<head>(Pages Router:pages/_document.tsx). - Vite: in
index.html, inside<head>. Astro and SvelteKit: the root layout orapp.html. - WordPress: Appearance → Theme File Editor →
header.php, before</head>. Or a header-code plugin like WPCode.
Or let the CLI do it: npx bugotter init adds the tag to your layout (see Get started). Or click Copy prompt for this step and paste it into your agent. The same script also catches browser errors.
Check it works
- Open your live site in a normal browser window, without an ad blocker.
- Back in BugOtter, the app's Setup tab says Waiting for the first visit… and refreshes on its own every 15 seconds.
- When the visit lands, the step turns green and the Traffic tab shows "1 visitor now".
Nothing after a minute? See common questions below.
What you see
Analytics in the top bar lists all your sites with visitors, revenue, top source and conversion. Click a site, or open an app's Traffic tab, for its dashboard:
- Tiles: Visitors, Revenue, Paid conversion, Revenue / visitor, Hit an error, Bounce rate and Time on site, each against the previous period. Click a tile to chart it.
- Chart: bars or a line, with markers for outages, error spikes, deploys, big payments, days that look like bots, and your own notes.
- Reports: Channels, Sources and Campaigns; Pages, Entry, Exit, Read and 404s; Countries, Regions and Cities; Devices, Browsers, OS and Languages; Goals, Outbound, Downloads and Forms. Each shows 8 rows; Show all shows up to 100.
- Filter: click any row to filter everything by it. Filters show as chips at the top; click × or Clear to remove them.
- Range: Today, Last 24 hours, Last 7 days, Last 30 days, Last 90 days, Last 6 months, Last 12 months, Last 2 years, or Custom. Only the ranges your plan keeps are listed.
- Compare: shows the previous period on the chart and "was X" on each tile.
- Live: "N visitors now" counts the last 5 minutes. Click it to see who.
- Rank cards by: Revenue, your top goal, or Visitors.
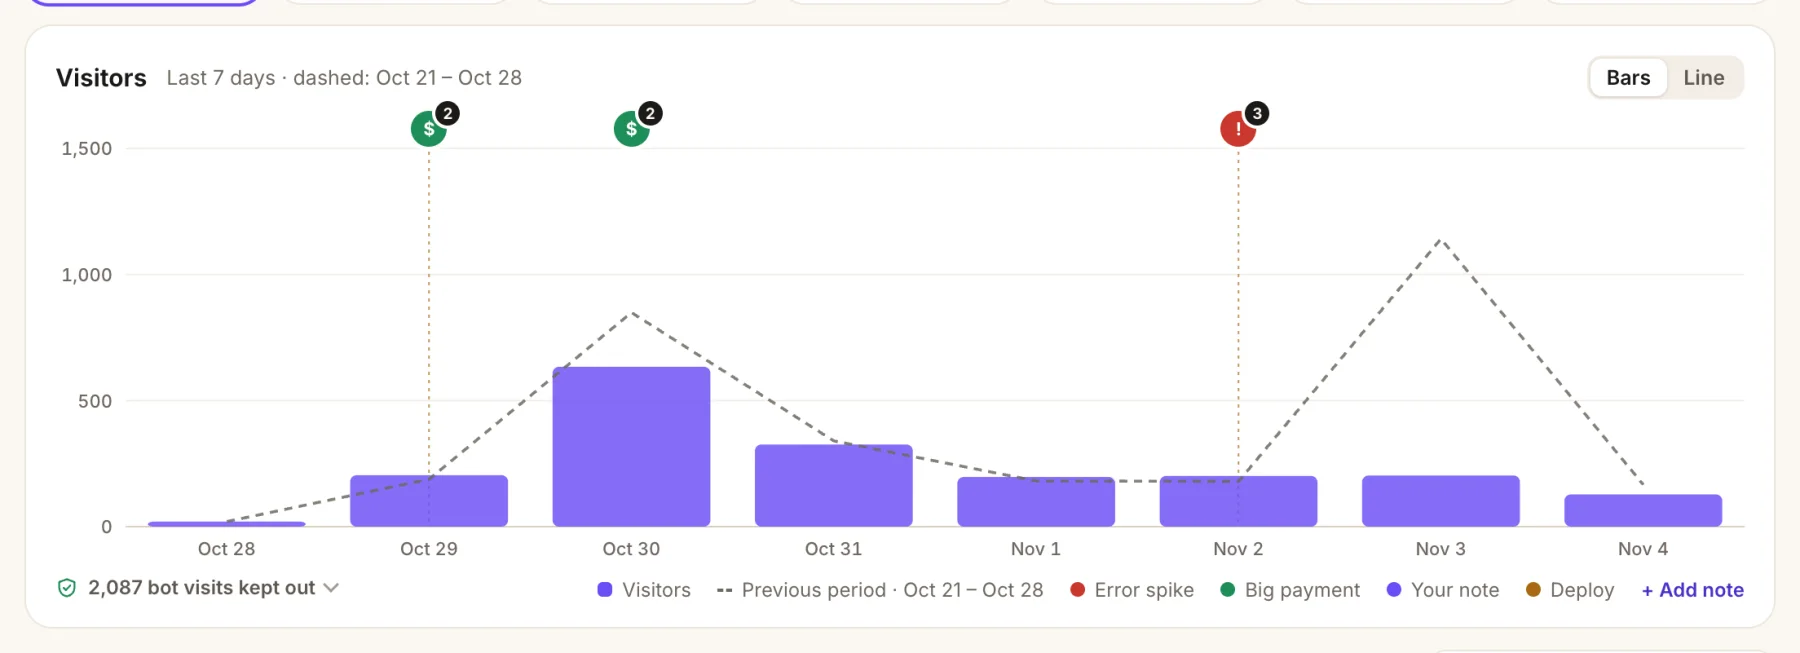
- Markers for big payments, error spikes, deploys and your notes.
- The dashed line is the previous period, when Compare is on.
- Bot visits kept out of the numbers.

- Tabs switch the report: Channels, Sources, Campaigns.
- Revenue and the share of visitors who hit an error, per row.
- When one source hits errors far more often than average, a note links to the error.
Older than 90 days, BugOtter keeps daily totals. Filters, paths, reading, 404s, funnels and single visits cover the last 90 days. History goes back 6 months on Starter, 1 year on Builder, 2 years on Pro.
Goals
A goal is anything you want to count, like a signup. Call this after the action happens:
window.bo?.track("signup");
window.bo?.track("signup", { plan: "pro" });   // with properties
There's nothing to set up in BugOtter: any name you send appears under Goals. Filter by a goal to see its properties. Names can be 64 characters; up to 10 properties, with keys up to 40 characters and values up to 100. Text, numbers and true/false are kept.
Outbound link clicks, file downloads and form submissions are counted on their own (see below).
Funnels
A funnel shows how many visitors go through steps in order, and where they drop off.
- On the dashboard, click + New funnel.
- Give it a name, like "Signup".
- Write one step per line. A page is its path (
/pricing; end with*for a prefix, like/blog/*). A goal isgoal: signup. - Click Save funnel.
A funnel needs at least two steps and uses up to eight. The dashboard shows your first three funnels.
Paths
Paths shows the most common routes through your site, up to 4 pages long. Pick where they start (Any page, or one page) and where they end (a goal, or Anywhere). Routes end in the goal, in "left", or in "more pages". The biggest leak is called out.
Visitors
The Visitors card lists single visits: Recent, Paying (visitors whose payment was linked to a visit), Live now and Hit an error. Pick one to see their pages, errors and payments in order. Visitors are anonymous: no names, emails or IP addresses.
Chart notes
Mark what happened on a day, like a launch post. Click + Add note under the chart, pick the day, write up to 80 characters, then Add note. Notes are private: they never show on share links. To remove one, click it on the chart → Delete note.
Customize
Hide the parts of the dashboard you don't look at. Click Customize, then Hide on any section: Channels and sources, Pages, Countries, Devices, Goals, Funnels, Paths, Visitors, Google search or Bring your history. Click Done. This applies to every app on your account. Reset shows everything again.
Export
Click Export for a CSV of one report, for the range and filters on screen: Visitors by day, Pages, Entry pages, Sources, Channels, Campaigns, Countries, Devices, Browsers, Goals or Outbound links. Up to 1,000 rows each. CSVs are built from single visits, so they cover the last 90 days. For scripts, the Stats API returns the same numbers as JSON.
Google search
See which Google searches bring visitors, and the revenue each search landing page brought. Read-only.
- On a site's dashboard, find Google search and click Connect.
- Sign in with the Google account that has the site in Search Console, and allow read access.
- BugOtter picks the matching property (a Domain property first, then a URL prefix). If it can't tell, pick one and click Use this property.
- The last 90 days sync in about a minute.
You get clicks, impressions, CTR and position per query, page and country. It syncs every 6 hours; Google's data is a few days behind. Its settings button has Sync now and Unlink this site. All Google connections are listed in Settings → Connections.
Revenue by source
See which post, search or referrer brought paying customers. First connect a payment provider and link products to apps. Then:
- Stripe Payment Links (
buy.stripe.com) are tagged automatically. Nothing to do. - Your own checkout: pass the visit id as metadata when you create the checkout.
// browser
const visitorId = window.bo?.visitorId?.();
// server, when creating the Stripe Checkout Session, Polar or Creem checkout
metadata: { bugotter_visitor_id: visitorId }
Revenue then shows on the Revenue tile, in every report (rank cards by Revenue), and under Visitors → Paying.
The visit id lives for one visit (sessionStorage). Add data-attribution="cookie" to keep it for a year in a first-party cookie, for longer journeys (you may need consent for that cookie). Stripe payments are linked through a Checkout Session, an invoice or a subscription, not a bare PaymentIntent. Payment Links on your own Stripe domain aren't tagged. Lemon Squeezy doesn't expose checkout data in its API yet, so its revenue isn't linked to sources. With Creem, subscriptions (and their renewals) are linked; one-time payments aren't yet.
The revenue by traffic source guide walks through it end to end.
Ad blockers
Ad blockers drop 20–40% of visitors for most analytics. Serve the script from your own domain and they can't tell. Proxy only these three paths; nothing else on BugOtter is reachable this way.
- Open the app → Settings → Ad blockers. The snippets there have your proxy key filled in.
- Copy the one for your setup: Copy for Next.js, Copy vercel.json or Copy Netlify _redirects.
- Swap your script tag for the one shown (
src="/_bo/bo.js"), and deploy.
async rewrites() {
  return [
    { source: "/_bo/bo.js", destination: "https://bugotter.com/bo.js" },
    { source: "/_bo/api/collect", destination: "https://bugotter.com/api/collect?via=YOUR_PROXY_KEY" },
    { source: "/_bo/api/errors", destination: "https://bugotter.com/api/errors?via=YOUR_PROXY_KEY" },
  ];
}
// then: <script defer src="/_bo/bo.js" data-app="YOUR_APP_ID"></script>Measured on its own
Nothing to add. The same script also counts:
- Page changes in single-page apps: each route change is a pageview. A visit ends after 30 minutes without activity.
- Reading: time on page and how far down people scroll (the Read report).
- Page speed from real visits: how long the main content takes to show (LCP), how fast the page answers a click (INP) and how much it jumps around (CLS). Shown as Fast, OK or Slow once a page has 3 samples.
- Outbound links: clicks to other sites, by host.
- Downloads: clicks on links to files (.pdf, .zip, .dmg and the like), by file name. Turn off with
data-downloads="off". - Forms: one event per submission, named after the form's
nameorid, or where it posts to. What people type is never read. Name a form withdata-bo-name="signup", skip one withdata-bo-skip, or turn all off withdata-forms="off". - Broken links: a page whose title or first heading says "404" or "not found" sends a
404event, so you see which old links people still follow. - Sources: the referrer, and
utm_source,reforviain the address, plusutm_mediumandutm_campaign.
Your own visits
Open any page of your site with #bo-ignore at the end of the address. The app's Settings → Don't count my visits has a button that does it for you. That browser stops being counted. #bo-count undoes it. It's remembered per browser, so do it once on each device you test with.
Script options
Attributes on the script tag:
data-attribution="cookie": keep the visit id for a year, for revenue by source on longer journeys.data-exclude="/app,/account": send nothing from pages under those paths, such as the private part of a single-page app.data-errors="off": don't capture browser errors.data-release="…"tags them with a release, for source maps.data-downloads="off",data-forms="off": turn off those events.data-api="…": send to another address than the one the script was loaded from.data-allow-local: let the script run in automated browsers, for testing. Visits must still come from your app's own domain, solocalhostisn't counted on bugotter.com.
Browsers that send Do Not Track aren't counted, and their errors aren't sent either.
Bots kept out
Only people count. BugOtter refuses these before they reach your numbers. The dashboard shows how many it kept out and why:
- Bots that say so: search and AI crawlers, link previews, uptime monitors and tools like
curl. - Scripted browsers: headless Chrome, Puppeteer, Playwright, Selenium and speed tests.
- Cloud servers: visits from AWS, Google Cloud, Azure, Hetzner, OVH, DigitalOcean and other hosting networks, refreshed daily. VPN and privacy-relay networks (iCloud Private Relay, Cloudflare WARP) are left in, so real people on them still count.
- Sent from outside your site: the browser must say the visit came from your app's domain (or a subdomain). Events sent from a server or a script are dropped, so
/api/collectcan't be used server-side. - Referrer spam: sites that fake visits to get their name into your reports.
- Too fast: one visitor opening dozens of pages a minute.
If you serve the script from your own domain, the cloud-server check is skipped: we'd only see your server's address. Bots that run a full browser can still slip through; when a day looks like that (a spike from one place, nobody staying), the chart marks it "Looks like bots".
Bring your history
Coming from Plausible or Umami? Open Analytics in the top bar → your site, and find Bring your history.
- Pick Plausible or Umami.
- Export from there. Plausible: Site settings → Imports & Exports → Export to CSV, and drop the zip as it is. Umami: Settings → Data → Export, then drop the file from the email as it is.
- Drop the file (or Choose file). It's read in your browser.
- Check the preview, then click Import.
Only daily totals are kept: visitors, pages, sources, countries, devices and browsers. Those days show up before your BugOtter data starts, never on top of it. Re-importing the same file replaces it, and Undo import removes it. Up to 200 MB per file and 10 years.
Common questions
The script is in, but no visits show up
Check these, in order:
- Is the tag on the live site? View the page source and look for
bo.js. It must be on every page, with your app'sdata-appid. - Ad blocker or Do Not Track? Both stop your own visit. Try a private window without extensions, or set up the proxy.
- Testing on localhost? Visits must come from your app's own domain. Test on the deployed site.
- Did you ignore yourself? If you once opened
#bo-ignore, open#bo-countto be counted again. - A different domain? A site on
www.example.comcounts for an app onexample.com, but not for another domain. Add each domain as its own app. - Excluded path? Pages under
data-excludesend nothing. - Paused? Nothing is recorded while the app is asleep, after the trial ends, when it's over your plan's app limit, or after two months over your pageview pool.
Why are my numbers lower than Google Analytics?
BugOtter leaves out bots, cloud servers and Do Not Track browsers, and ad blockers hide some visitors from every tool. The proxy brings most of those back.
Why is the same person counted again tomorrow?
To stay cookieless, a visitor is recognised by a hash that changes every day. The same person on two days counts as two visitors.
The export doesn't match a 2-year range
Exports come from single visits, which are kept for 90 days. Older days only exist as daily totals on the chart.
Search Console says I have no properties
The Google account you picked has no verified Search Console property for this site. Add the site in Search Console first, then connect again. If Google says BugOtter didn't get offline access, remove BugOtter from your Google account's permissions and connect again.
The history import says "No visits found in that file"
It's probably not the right export. Plausible needs the zip of imported_*.csv files from Imports & Exports; Umami needs its data export with session_id and created_at columns.